Stop Losing Customers Before They Even See Value
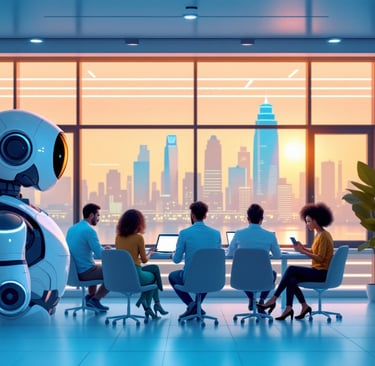
Powered by Agentic AI.
Most churn and missed upsells happen because customers never fully adopt your product. SuccessMateAI’s intelligent agents guide every customer through a proven adoption path—using automation and AI to deliver early value, unlock expansion, and prevent churn before it starts.

See how it works
Watch how our AI agents guide customers to full adoption—unlocking upsells and preventing churn before it starts
The Problem?
Lost Net Revenue
Lost Revenue due to Early Customer Disengagement
📉Untapped Customer Potential
Unscalable Customer Success


Customers leave because they don’t see value fast enough. Without proper guidance, they disengage and churn—not because the product isn’t great, but because they weren’t handheld through the process.
Existing customers aren’t reaching their full potential. Companies miss out on expansion and upsell/cross-sell opportunities simply because they aren’t monitoring customer engagement or guiding them toward growth.
With thousands of customers, it’s impossible to provide personalized, proactive engagement without automation.
You’re losing money—not because your product isn’t great, but because too many customers never fully adopt it.
They drop off, get stuck, or never realize its value, making upsells impossible and churn inevitable.
Three costly reasons this happens:
What if churn never had the chance to start?
Imagine if every customer followed a proven path to adoption—getting exactly the right guidance, at the right time, to see real value. Now imagine that happening automatically, at scale, without overloading your team.
The Possibility
The Solution: Proactive AI That Ensures Adoption
SuccessMateAI uses a swarm of intelligent agents to guide every customer through a proven adoption path—so they see value early, stay engaged, and are ready for upsells and cross-sells.
Amanda, your Customer Success AI Agent, monitors each journey in real time, takes proactive action to keep customers on track, and loops in your team only when human touch is needed.


How Amanda Helps You Win?
Accelerates onboarding so customers see value faster
Keeps engagement high with timely, automated actions
Unlocks upsell opportunities when customers are ready
Prevents churn by resolving risks before they escalate

SuccessMate AI transformed our customer engagement, making retention effortless and boosting our revenue significantly.
Tech Innovators

Our customer success has skyrocketed thanks to SuccessMate AI's automated check-ins and insightful upsell strategies.
Growth Partners

★★★★★
★★★★★


